 John Ferrell
The Problem…The Whole Problem
While we all like to blame COVID-19 for all of our troubles. The fact is that the industry was already shaky. The coronavirus just gave us the nudge....


The industry didn't start with unconventionals and neither does our data. We cover the full historical dataset across every producing state and province. Don't settle for inferior data, check out our coverage for any state or province you're interested in.

So laying down rigs is a pretty popular idea. Makes sense. If you stop drilling, you slow your production. It’s also one of the easiest cuts to be made. If you’re an active operator, all you have to do is…nothing. Ok, that’s not exactly true. You will need to make a PowerPoint explaining why your cash flow is in a nose dive. You might also have to get on a call and explain yourself. No big deal though. In case you haven’t noticed, we’ve got this whole global pandemic thing going on and you get a pass. But I digress…
The purpose of this post is to explore what the net effect of drilling looks like. Specifically, what will a new rig do to the production supply. The drill is towards the very beginning of a wells life, so it is important to note that rigs are not always directly correlated to production. If you’re me though, it is helpful to be able to put some context around the rig reports. That’s what we’ll try to do here.
If you haven’t read it yet, step back and check out our post, The Problem…The Whole Problem. This will give you a good basis for what we’re looking at.
Wells are being drilled faster than ever. There are very few wells now that take more than a week to drill. Completion times have also decreased over time. However, the practice of drilling without completing the wells became very popular in the last downturn. The first step in understanding the impact of new drills is to understand the timeline. By that I mean the time it takes from when drill hits the ground to when the production hits the market.
First, let’s lay out our search criteria. We’re going to look at the trend over the past 5 years. Additionally, we’re going to limit our search to wells that were spud before June of 2019. The reason we are putting the max date is due to the lag in reporting. If we include more recently drilled wells, the numbers of wells returned gets low and it skews the results. We’re also only showing wells that were spud and had their first reported production since 2015. This helps ensure we are looking at new drills. This will shrink our set, but will help provide the consistency we’re looking for.
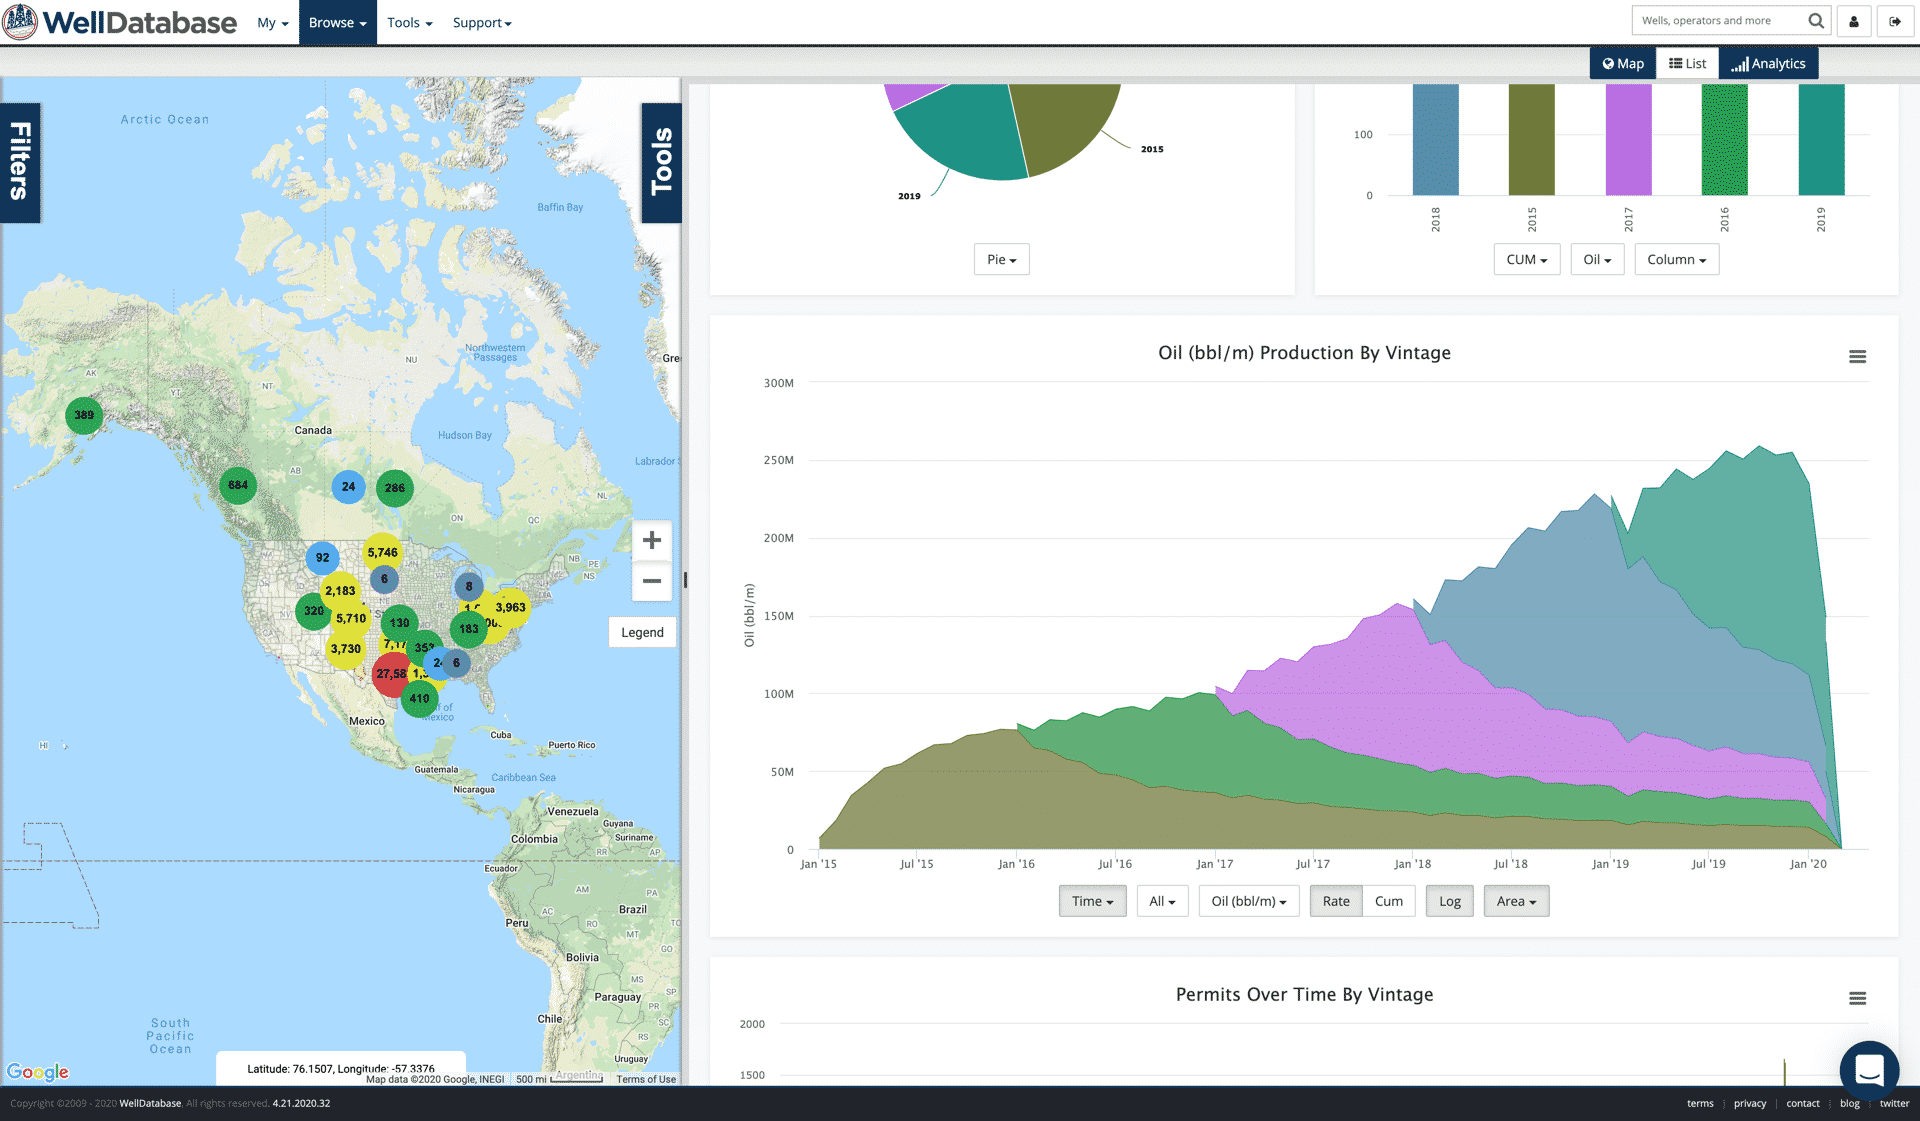
Here’s the full set. The chart here shows the count of wells spud over time in this set and is grouped by when the wells started producing.

The majority of the periods in our search have over 1000 data points, so we’re pretty comfortable with evaluating these to come up with an overall trend.
Here’s link to the search we’re using – https://app.welldatabase.com/Browse/Public/Index/4ckpN
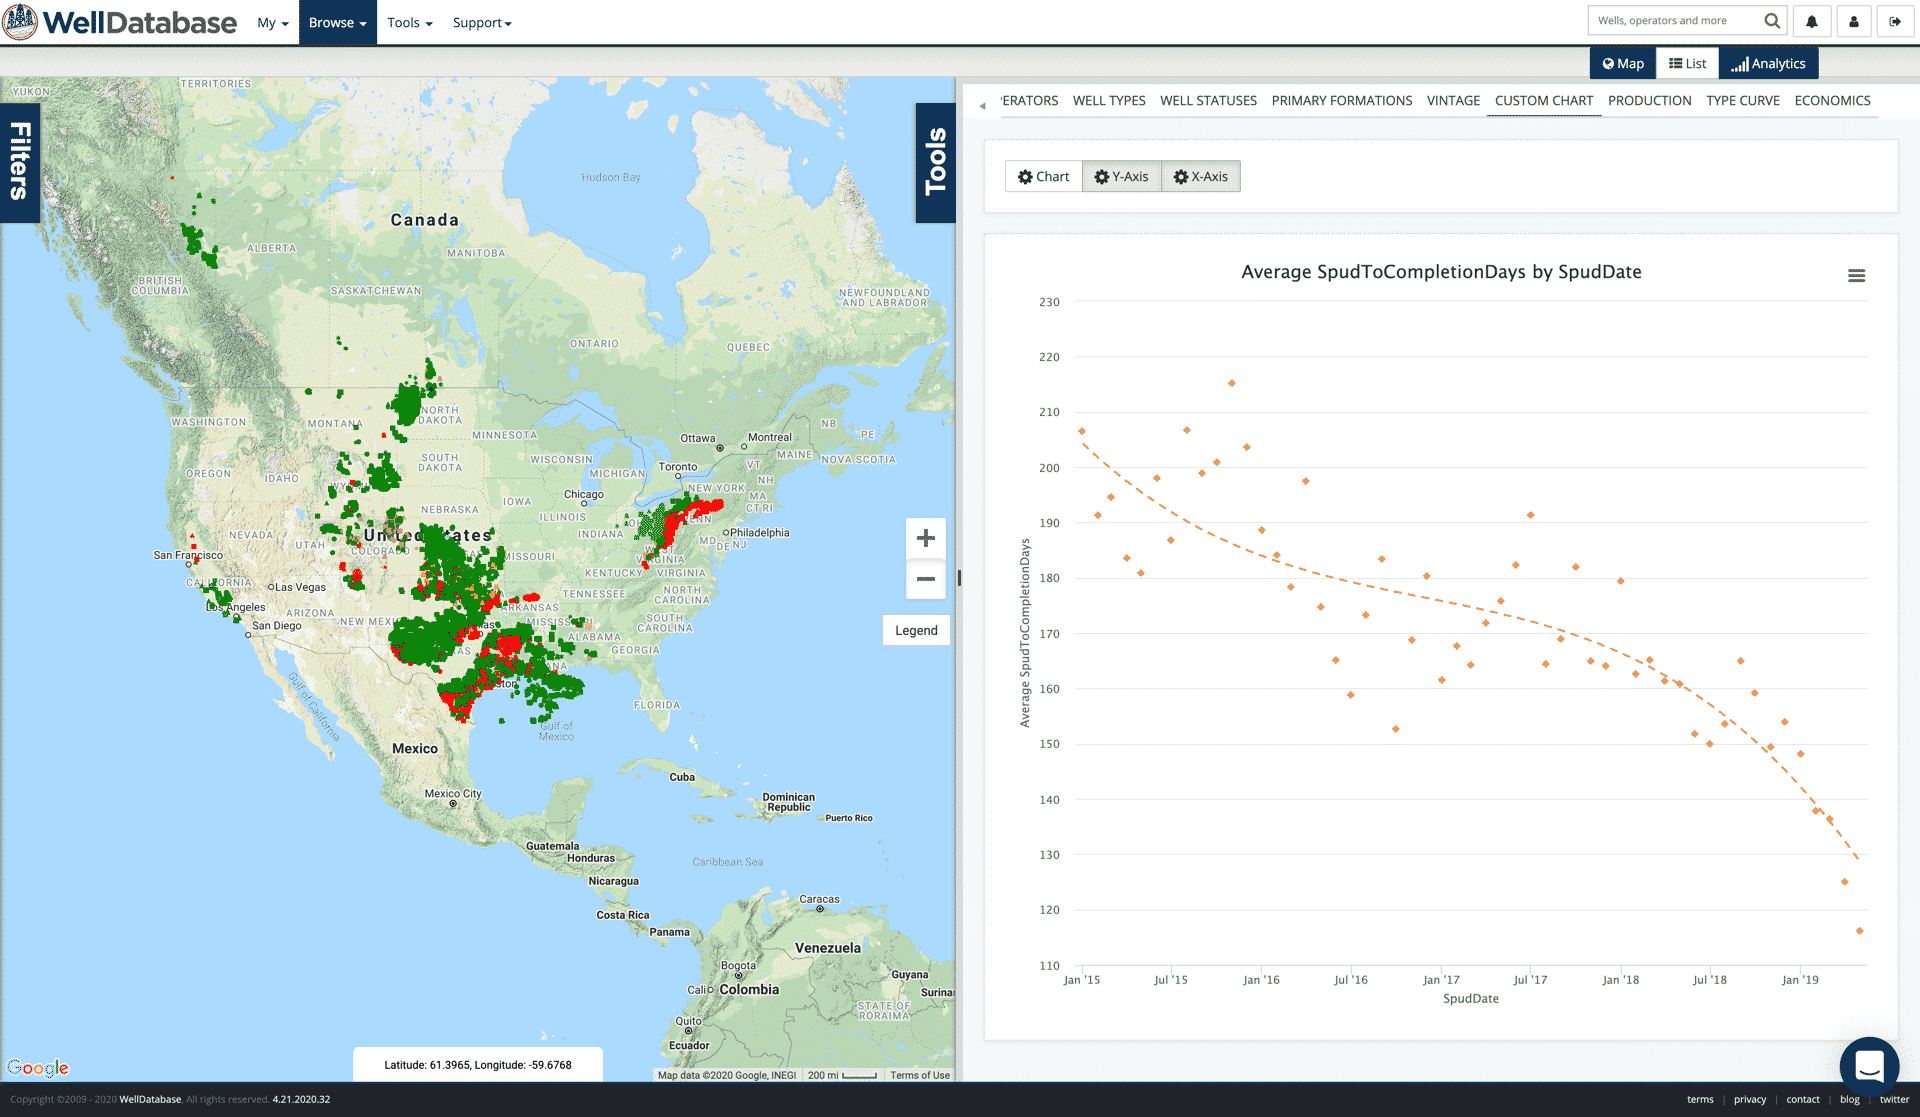
Now on the the timelines. Here we plot the average days from when a well is spud to when it is completed.

What we see here is a trend towards shorter time spans from when wells are being spud to when they’re being completed. Five years ago it was around 200 days and the more recent wells are 120 days. With the amount of DUCs working their way down, it’s logical to see the times starting to shrink.
To get a touch more granular, we’ll whittle the results down to only wells where wells are actively being drilled. We’ll zoom out to catch Alaska as well.

Here’s a link to the search – https://app.welldatabase.com/Browse/Public/Index/YKF0x
So not a real noticeable difference. We’re still looking at around 120 days from when a well is drilled to when it is completed on average. We’ll keep this set though to help with the next steps.
Now let’s look at the days from when a well is completed to when we see production hit the regulatory agencies for this set.

We do see a downward trend here. This could be due to anything from operational efficiencies to changes in strategy with regards to completing multiple wells on a pad before letting them flow. It also could just be a factor of paperwork. With the average hanging around 10 days for the past year, we can just use that.
So now we have our timeline. For every well that is drilled, we will see that production around 130 days later. That means laying down rigs will not have an effect on production until about 4 months from now. That also means that there are thousands of wells in the drilled but not completed state. On the whole, we see about 8,000 DUCs of all types. EIA says ~7,600, so we’re all in the same ballpark. We’ll address completions specifically in another post.
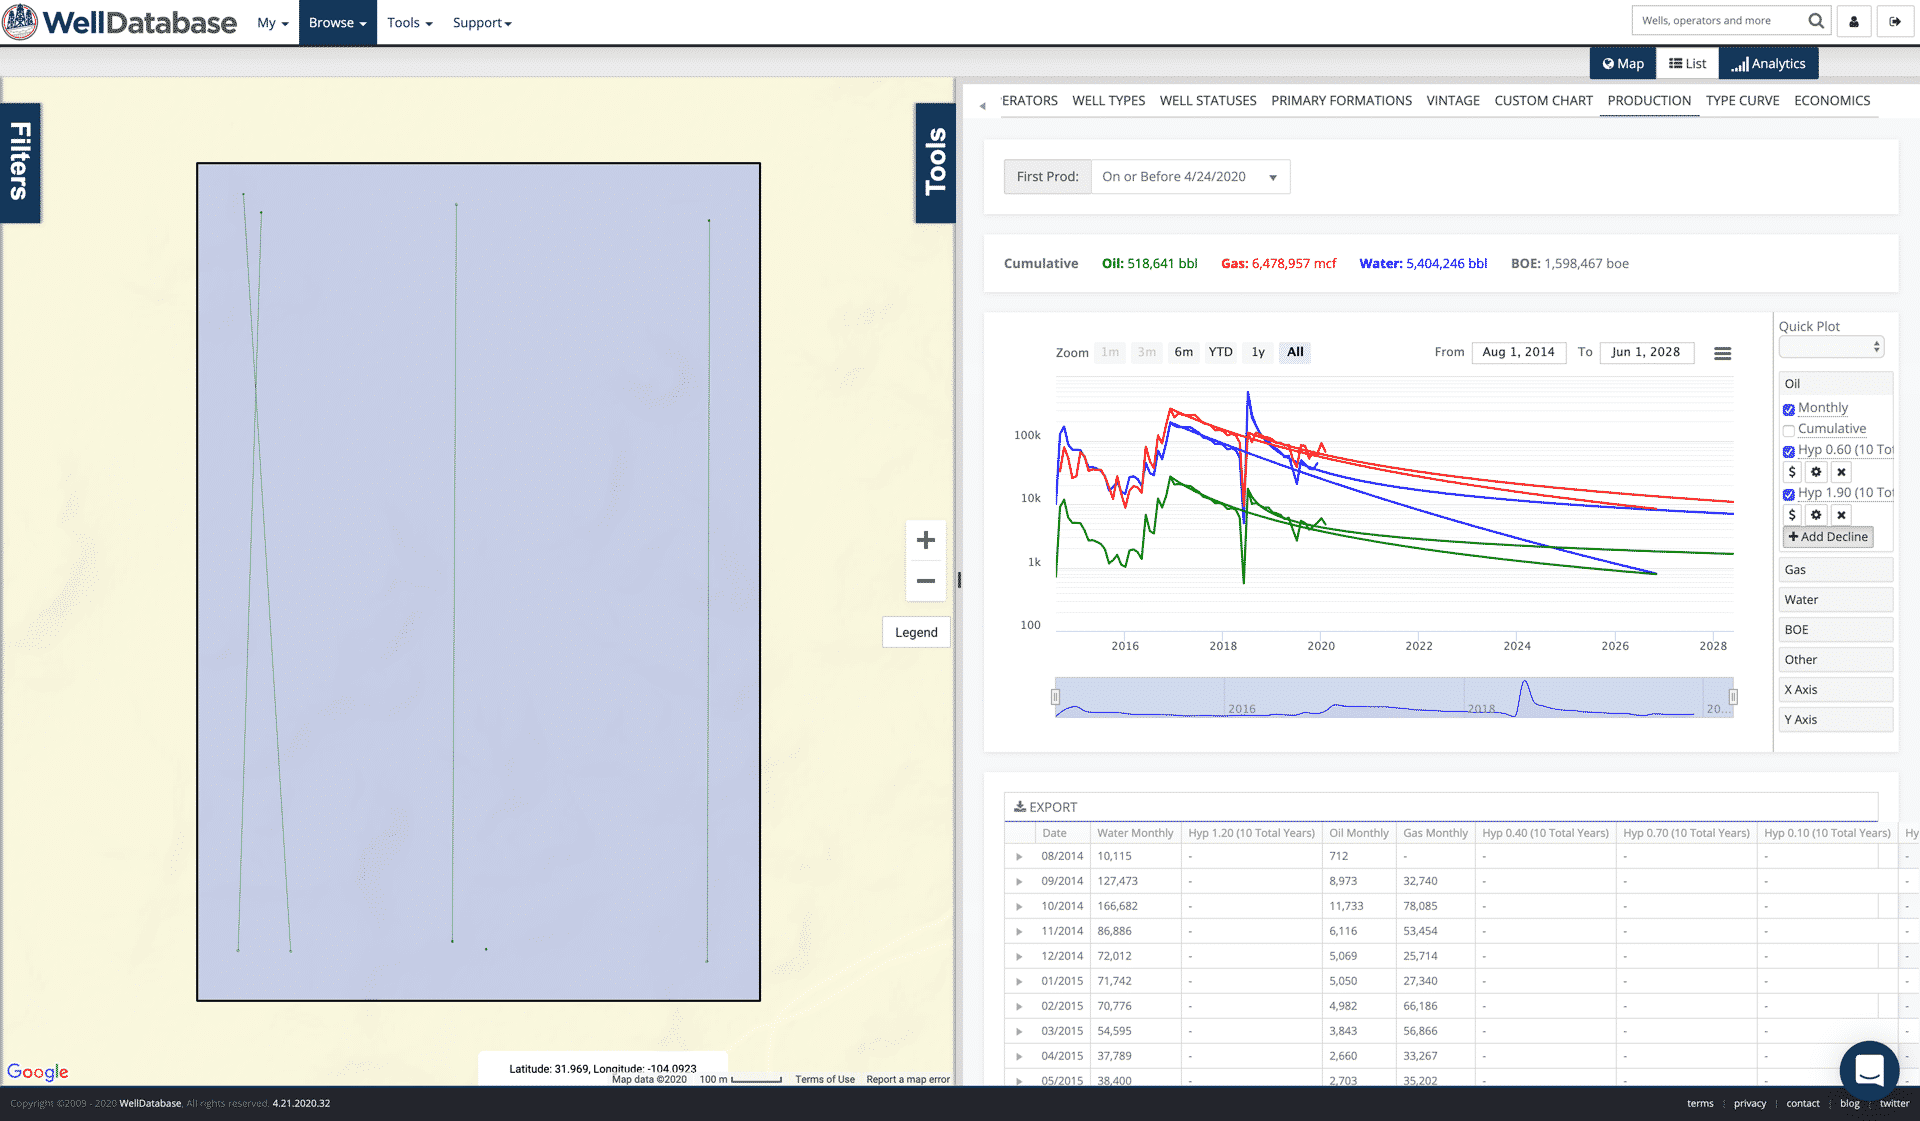
We have established the timeline, so now we’ll iron out the average production for these wells. We could go on for days diving into the details on how to accurately predict production, but for this post we’re going to keep it simple. In WellDatabase, we can just hop over to the State tab and see the type curve by state for the wells in our search. Here’s what we see.

It’s worth pointing out that we are grouping a number of well types, well bore profiles, formations, and more into these numbers. Fortunately, the vast majority of new drills are horizontal oil wells. For this purpose, it’s good enough.
Here’s a table that shows what the average new drill adds to the supply (in barrels of oil per day) by state.
| 1 | 2 | 3 | 4 | 5 | 6 | 7 | 8 | 9 | 10 | 11 | 12 | |
| Alaska | 465 | 822 | 737 | 676 | 682 | 667 | 646 | 628 | 593 | 612 | 599 | 582 |
| California | 29 | 31 | 30 | 30 | 29 | 28 | 28 | 27 | 26 | 25 | 25 | 25 |
| Colorado | 165 | 275 | 323 | 301 | 233 | 203 | 171 | 151 | 129 | 124 | 103 | 92 |
| Gulf of Mexico | 2115 | 3173 | 3442 | 3786 | 3827 | 3715 | 3556 | 3532 | 3553 | 3321 | 3329 | 3249 |
| Louisiana | 23 | 23 | 22 | 20 | 18 | 17 | 17 | 14 | 14 | 13 | 13 | 13 |
| New Mexico | 552 | 831 | 672 | 547 | 457 | 401 | 349 | 308 | 276 | 252 | 231 | 214 |
| North Dakota | 715 | 859 | 772 | 683 | 624 | 563 | 491 | 442 | 386 | 349 | 311 | 285 |
| Ohio | 76 | 95 | 105 | 99 | 91 | 81 | 71 | 61 | 49 | 41 | 39 | 36 |
| Oklahoma | 79 | 146 | 123 | 99 | 82 | 71 | 62 | 55 | 49 | 45 | 41 | 37 |
| Pennsylvania | 0 | 0 | 0 | 0 | 0 | 0 | 0 | 0 | 0 | 0 | 0 | 0 |
| Texas | 449 | 499 | 427 | 361 | 300 | 263 | 234 | 210 | 190 | 175 | 159 | 151 |
| Utah | 473 | 528 | 412 | 345 | 286 | 240 | 211 | 182 | 171 | 165 | 147 | 130 |
| West Virginia | 54 | 129 | 104 | 89 | 76 | 62 | 52 | 44 | 38 | 32 | 27 | 24 |
| Wyoming | 232 | 291 | 226 | 182 | 154 | 131 | 120 | 101 | 91 | 82 | 75 | 69 |
For the rig count as of 4/17/2020, the affect on total production could look like this.
| Aug-20 | Sep-20 | Oct-20 | Nov-20 | Dec-20 | Jan-21 | Feb-21 | Mar-21 | Apr-21 | May-21 | Jun-21 | Jul-21 | |
| Alaska | 1394 | 2465 | 2210 | 2029 | 2046 | 2000 | 1939 | 1885 | 1780 | 1836 | 1797 | 1745 |
| California | 229 | 248 | 238 | 237 | 231 | 224 | 220 | 217 | 212 | 204 | 200 | 197 |
| Colorado | 2643 | 4398 | 5170 | 4821 | 3733 | 3249 | 2742 | 2424 | 2070 | 1980 | 1649 | 1470 |
| Gulf of Mexico | 35957 | 53939 | 58522 | 64369 | 65053 | 63157 | 60457 | 60038 | 60407 | 56462 | 56596 | 55228 |
| Louisiana | 576 | 578 | 539 | 503 | 450 | 419 | 413 | 362 | 340 | 329 | 329 | 317 |
| New Mexico | 46370 | 69824 | 56416 | 45935 | 38362 | 33712 | 29319 | 25833 | 23196 | 21158 | 19416 | 17978 |
| North Dakota | 24313 | 29208 | 26245 | 23211 | 21231 | 19136 | 16688 | 15014 | 13116 | 11858 | 10588 | 9690 |
| Ohio | 684 | 853 | 944 | 890 | 822 | 725 | 642 | 546 | 440 | 373 | 347 | 322 |
| Oklahoma | 1904 | 3514 | 2944 | 2385 | 1965 | 1701 | 1488 | 1332 | 1183 | 1075 | 981 | 899 |
| Pennsylvania | 8 | 7 | 7 | 6 | 7 | 5 | 5 | 4 | 4 | 4 | 3 | 3 |
| Texas | 117126 | 130213 | 111399 | 94199 | 78321 | 68559 | 60974 | 54749 | 49686 | 45671 | 41579 | 39417 |
| Utah | 2366 | 2642 | 2061 | 1726 | 1429 | 1202 | 1055 | 908 | 853 | 824 | 733 | 650 |
| West Virginia | 544 | 1291 | 1043 | 892 | 761 | 620 | 521 | 444 | 378 | 316 | 268 | 236 |
| Wyoming | 1394 | 1743 | 1355 | 1094 | 922 | 786 | 718 | 605 | 548 | 491 | 449 | 412 |
| Total | 235509 | 300922 | 269093 | 242297 | 215332 | 195497 | 177181 | 164362 | 154214 | 142578 | 134935 | ##### |
These numbers assume that the new drills are completed along the timeline that we established earlier. Given the current economic environment, that is a very big assumption. These numbers are based on a weekly rig count as well. You can roughly 4x those numbers based on the new wells that are drilled over the course of a month.
The goal of this blog is to highlight how a new drill affects production on average. These numbers are just a snapshot in time as well. However, you can run this same process in WellDatabase at any time to quantify what the rig count means.
We will continue down the path of putting the production pieces together next by looking at completions. Feel free to comment below if you have any questions or additional insights.
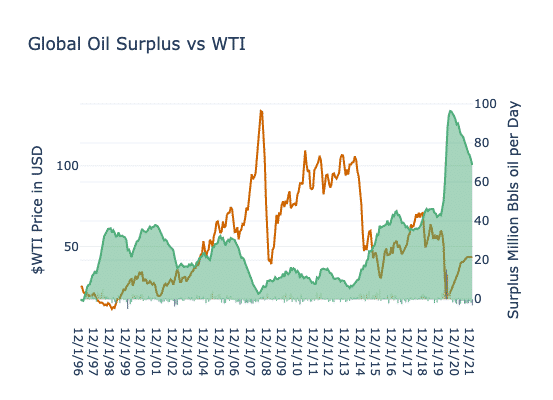
While we all like to blame COVID-19 for all of our troubles. The fact is that the industry was already shaky. The coronavirus just gave us the nudge....
After much fanfare, we are now arriving to the biggest question. What does it look like to shut in wells? How do they come back? What are the pros...
This is the next post in our series on production and the effects we are seeing in the market, completions. If you haven’t caught the other posts,...