 Aaron Watters

Potential clients often ask, “How are you different from your competitors?” I can rattle off the usual list, specifically speaking to how much more customizable our software is, but instead I thought I should demonstrate one of the many ways you can customize WellDatabase to fit your needs.
Activity has started to pick up, with the largest rig count recovery seen in the Permian Basin. If you’ve followed this activity, you would have noticed all of the M&A that has occurred in Delaware Basin over the last year. One of the many tools used to analyze these opportunities are lease shapefiles. These shapefiles provide a geographical representation of an Operator’s mineral and/or surface lease extents. Having the ability to overlay the leases on a map with well locations will allow you to get an idea of the PDP and PUD. WellDatabase gives you the ability to add your own shapefiles on the map fairly quickly and easily. Below, we demonstrate just how easy it is to upload shapefiles and quickly run an economic case for an area of interest (AOI).
For this example, we started by downloading public lease and geologic feature shapefiles from the GLO1 and University Lands2. They were first uploaded into QGIS3, a free open-source GIS software, to analyze the attributes and coverage in our particular AOI. In addition to the leasing shapefiles, the Permian Basin Geologic Features and Basement Faults shapefiles from University Lands were also downloaded. Adding faults and geologic features to the map can help you anticipate any potential drilling, completions, and production risks in an acreage position.
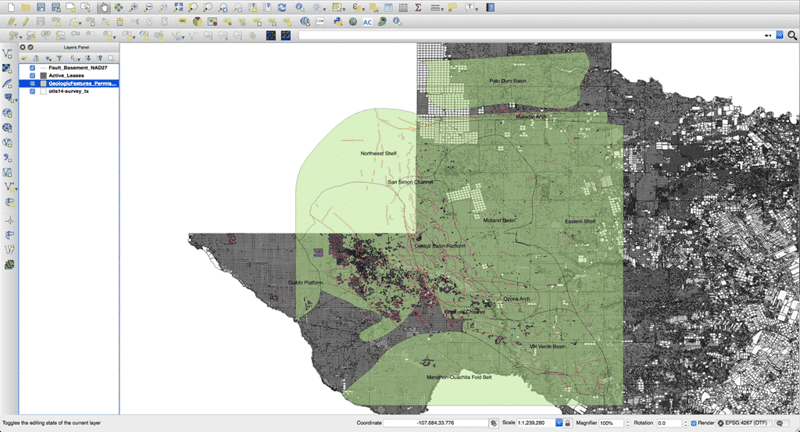
QGIS mapping service with the GLO Active Leases (purple polygons, Fault Basement (red lines), Geologic Features Permian Basin (green transparent polygons), and Texas Abstract layers. Notice the large concentration of leases in the Delaware Basin.
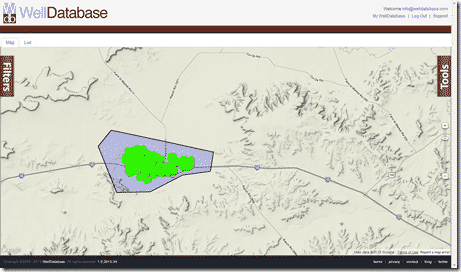
Once the shapefiles are edited to your preference, they should be ready to add to the map in WellDatabase. First, we are going to login to a WellDatabase account, go to the Browse > Wells page, and zoom into our AOI. For this exercise we have decided to focus on Reeves and Culberson counties because of the larger density of lease shapefiles for those counties. Next, we will start to filter our data down to horizontal wells with production.
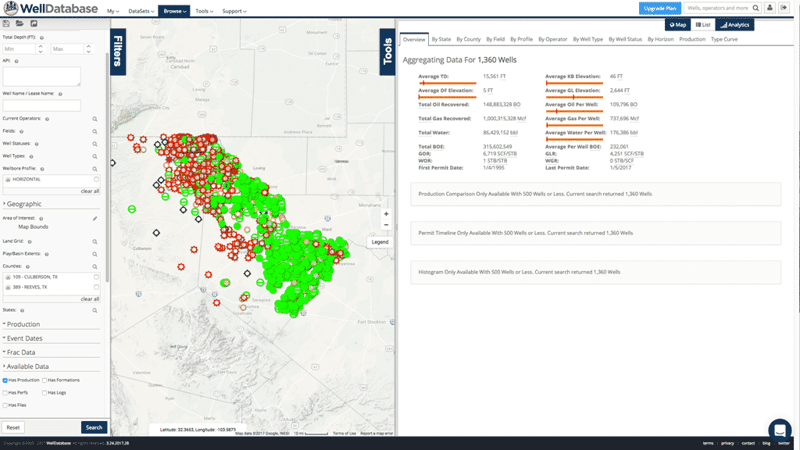
WellDatabase Browse > Wells page filtered to horizontal wells with production in Reeves and Culberson counties.
The Tools pane contains a variety of features; including Map Overlays, Colorize Groups, and even Bubble Maps. We will use the Map Overlays feature to upload the shapefiles we edited in QGIS. Once you’ve chosen the shapefile you would like to upload, you have the choice to change the fill and line color.
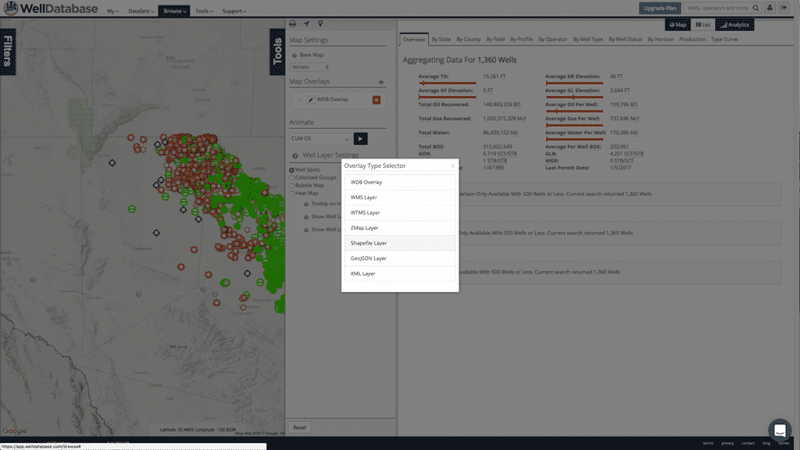
Illustrating how to upload a .shp onto the Map pane. Start by clicking the + next to Map Overlays and select the Shapefile Layer. You will be prompted to choose the file and line and fill color. Once you hit upload, the file will populate onto the map.
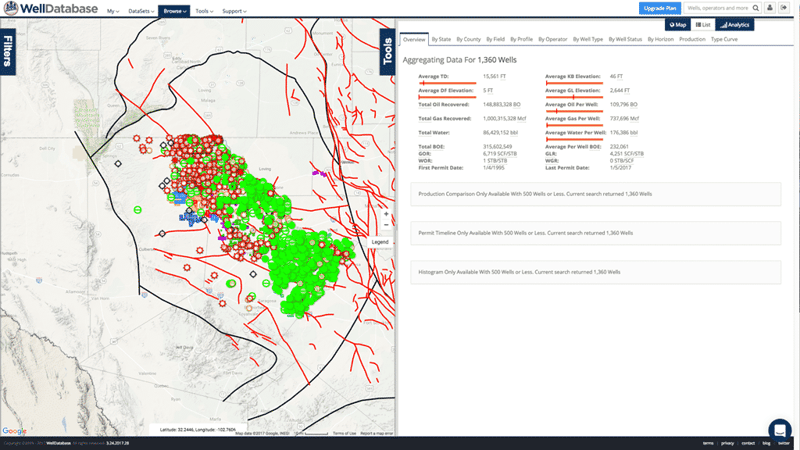
Red Line = Basement Faults; Black Lines = Permian Basin Geologic Features; Red, Black and Green Points = Well Locations; Blue Polygons = Open Leases.
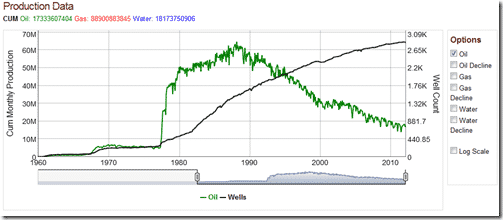
We’ve zoomed into an area at the Reeves/Culberson border, and for this exercise, the blue leases in the image below represent an acquisition opportunity. Lucky for us, there doesn’t appear to be any basement related faulting. To get an idea of what the production is for an average well in this area, select the Type Curve tab. The Type Curve tab takes the production for all the wells on our map and creates a best fit production curve. Because formations vary by depth and producibility, always make sure to filter wells to a specific Producing Formation when running this analysis. Fortunately, all the wells in this region are Wolfcamp producers so we didn’t have to bother with filtering. Included in the Type Curve analysis is the ability to run decline curves for Oil, Gas, and Water (when available). We’ve selected Decline in the Mean Oil drop down and set it to forecast out 5 years using a best fit curve. Once the curve is built, we can run our economic case by clicking the $ button.
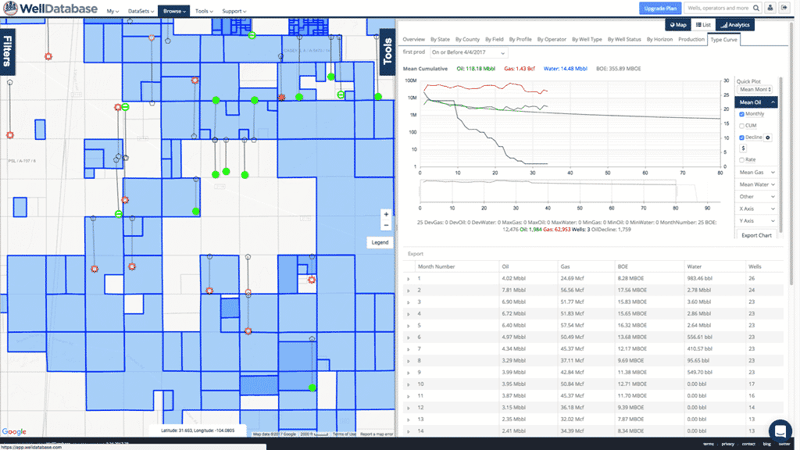
The Type Curve tab will roll up the production for each well on the map and create an Oil, Gas, and Water type curve. In the Mean Oil drop down you can perform decline curve analysis. Decline curve settings = Best Fit Line, Production Limit = 0, Forecast = 5yrs.
In the Economic Forecast module, you can set your economic benchmarks (i.e: working interest, selling price, etc). In our example, we have the working interest at 100%, selling price at $52, initial capex at $6,000,000, and lease operating cost at $15,000. Based on the oil type curve and decline forecast, the average well in this position will have yet to pay out at 35 weeks and by 80 weeks will have only paid slightly more than $1,000,000 (repeat for Mean Gas). You can easily change the inputs to see at what price and cost an average well in the area meets your economic threshold.
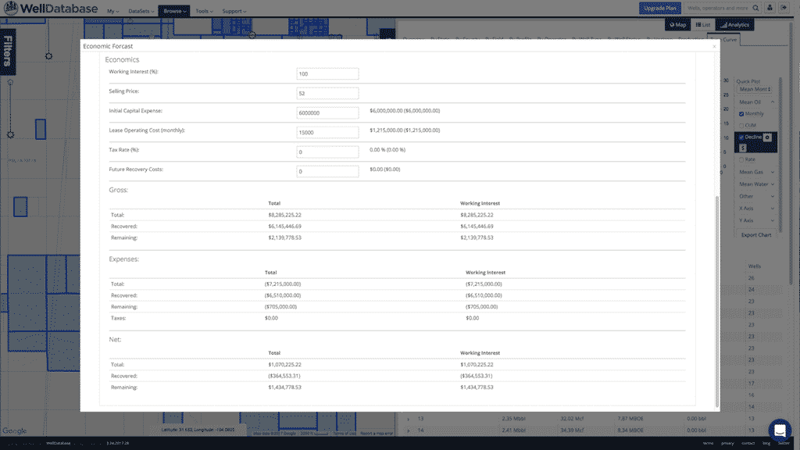
Clicking the $ under Decline will open the Economic Forecast module. Here you can run the economics for a well in this region based on the type curve and forecasted decline. At $52 Oil, these wells aren’t very economic.
For any questions or if you would like to request a live demonstration, please email us at info@welldatabase.com. Thanks.
1GLO Active Lease Shapefile: http://www.glo.texas.gov/land/land-management/gis/
2Permian Features and Fault Shapefiles: http://www.utlands.utsystem.edu/GISData.aspx
3QGIS Software: http://www.qgis.org/en/site/index.html