While we all like to blame COVID-19 for all of our troubles. The fact is that the industry was already shaky. The coronavirus just gave us the nudge. Yes, the drop off in demand has been historic. But the reality is that the market has been fighting supply & demand economics for a while. If we want to understand how to fix the problem, we need to understand it first. Fortunately, we have the data to do just that.
Due to the global nature of the problem, we will be referencing EIA data for this post. EIA generates historical data as well as forecasts for each of the data points included. We’ll be focusing on historical, but also evaluating their forecasts.
The data in this post is not revolutionary, but it does give us a baseline to work with. From a production vs consumption viewpoint, we will use the liquids production. This particular value includes NGLs and other liquid fuels. We’re using this value because the EIA publishes number on both production and consumption. We’ll break this down later and continue to reference this data in the next few posts.
Let’s start with a simple chart. Here is global liquid fuels production.
So we keep producing more. Nothing particularly strange about that. Here we’ll overlay the consumption. Simple supply & demand.
It looks like a pretty tight fit. Obviously moving around quite a bit, but still nothing goes completely out of whack until you get to current time. Note – You can click and drag to zoom in on any area.
So now let’s look at this data a little differently. We’ll plot out the +/- of the surplus. Basically, where has supply out-paced demand.
Note we’re plotting the surplus / deficit on a different scale. As you can see, these values have danced around each other over time. Sometimes we get a big movement, but nothing looks crazy.
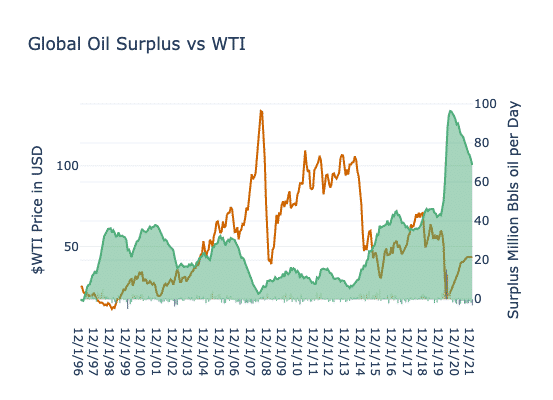
Over time, we see a different story though. When we take the net surplus and roll the values forward, we see the supply / demand problem that has plagued the industry for some time now.
I should point out that there are nuances to the dynamics here. The global economy outlook, wars, sanctions, and more. We’re not getting too deep on that here. The fact of the matter is that we see supply outpacing demand. A fairly steady trend going back to 2008.
Most people are familiar with supply & demand and the effects on pricing. Here is another plot with WTI included.
Again, their are nuances, but in general you can see a correlation between supply (or oversupply) and price. Throw in the fact that there is an actual cap on storage capacity and here we are.
Crude, NGLs, Condensate, & Others
All of our numbers have been a combined view of all liquid production. There are a number of factors that go into what portion of production becomes NGLs and what doesn’t. Here is a breakdown of US production by Crude vs NGLs.
Moving forward with our analysis, we won’t really be able to break down the crude vs NGLs. That breakdown is really variable based on a number of production and economic factors. For our purposes, it shoudln’t matter too much. We’ll focus on the big picture and try not to get bogged down in the weeds.
So where do we go from here? The good news is that there are ways to move the needle. None of which are particularly fun, but we can do it nonetheless. In our next posts, we’ll cover the various options and the reality of the cost / benefits.
Forecasts
The forward looking values in this data is of minimal value to us. Predicting how the supply will react and how the demand will return is anyone’s guess. The EIA appears to believe that demand will shoot back up to meet supply by August 2020. Furthermore, it predicts demand will quickly outpace supply moving forward. It is optimistic, but not completely unrealistic. Even with that somewhat optimistic viewpoint, we barely scratch the surface on eating away at that surplus. On the flip side, they only predict a drop of 2 million BOPD in the short term. There’s a lot of room for improvement there. We’ll explore all of this in the coming posts.
Bonus
For a bonus, here’s a look at BOE over the years. Well BOE & BOEE (Barrell of Oil Economic Equivalent). Thanks to Kass Copelin for coming up with that.
I throw that in just because there has been so much talk of BOE misuse recently. We’re well within range where BOE & BOEE are the same. Note it doesn’t have current prices. As of now, oil is right at $10 and gas is at 1.81. That comes to a BOEE of 5.52.
 John Ferrell