 John Ferrell
WellDatabase + NuTech
WellDatabase and NuTech Energy Alliance, LTD are proud to announce the allignment of their platforms to combine the best interpreted subsurface...


The industry didn't start with unconventionals and neither does our data. We cover the full historical dataset across every producing state and province. Don't settle for inferior data, check out our coverage for any state or province you're interested in.
We’ve been discussing all things production and how they pertain to the current market. If you haven’t read the first parts yet, here are the links
The Problem…The Whole Problem
The Effect of New Drills
We’re going to sidebar here a little here to do a quick post on choking back wells. In our previous post about the effect of new drills, we used some pretty broad type curves to estimate our production. In this post we dive into what effect choking back production could have on those results.
To keep this post simple, we’re going to compare two operators in the Delaware basin. We’ll be using wells drilled in the past 5 years by Anadarko (now Oxy, but Anadarko drilled these before they were acquired) and EOG. Both operators were considered very successful in the Delaware basin. The economics on both operator’s wells are good. The only difference is strategy. EOG is known for high IPs and maxing out early production. Anadarko’s strategy at the time called for a lower initial production with a flatter decline.
Here’s a link to the search we’ll use – https://app.welldatabase.com/Browse/Public/Index/3Fbmp
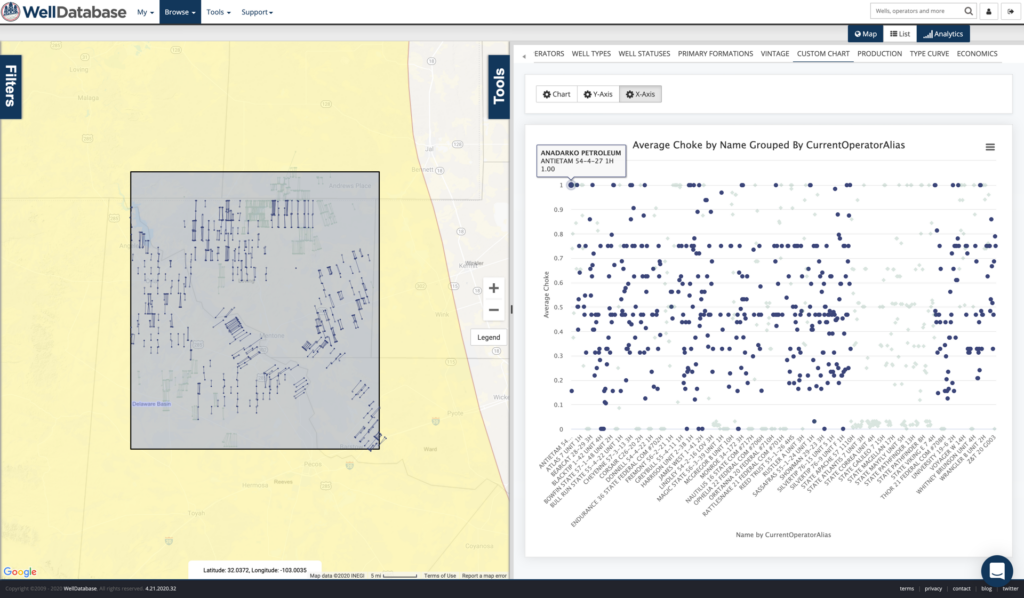
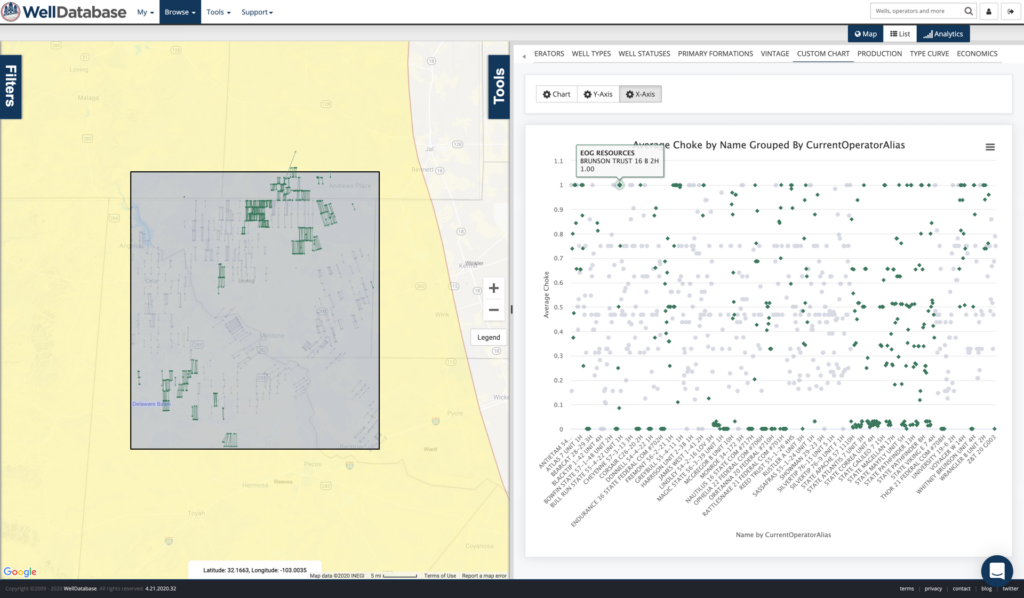
To highlight the difference in choke management between these two operators, we’ll plot out the choke values per well.
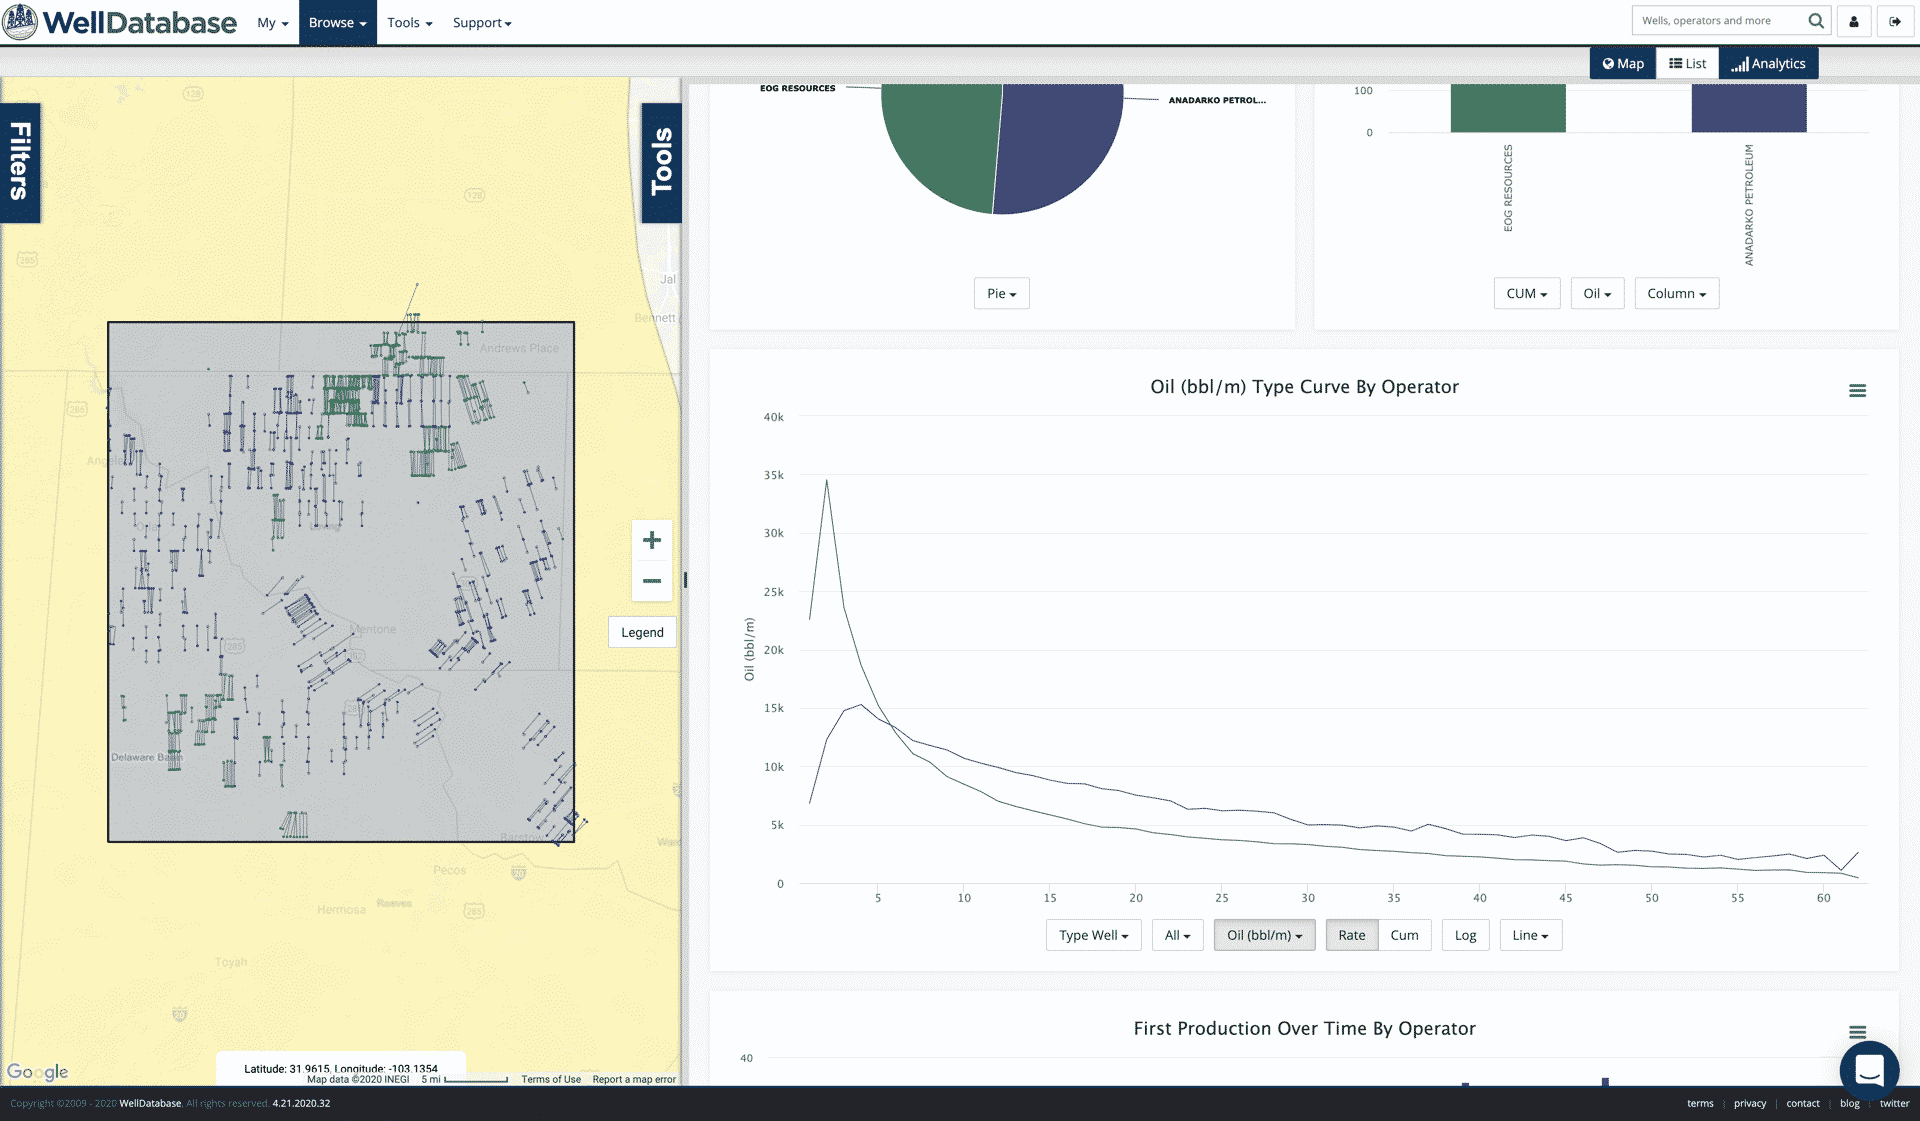
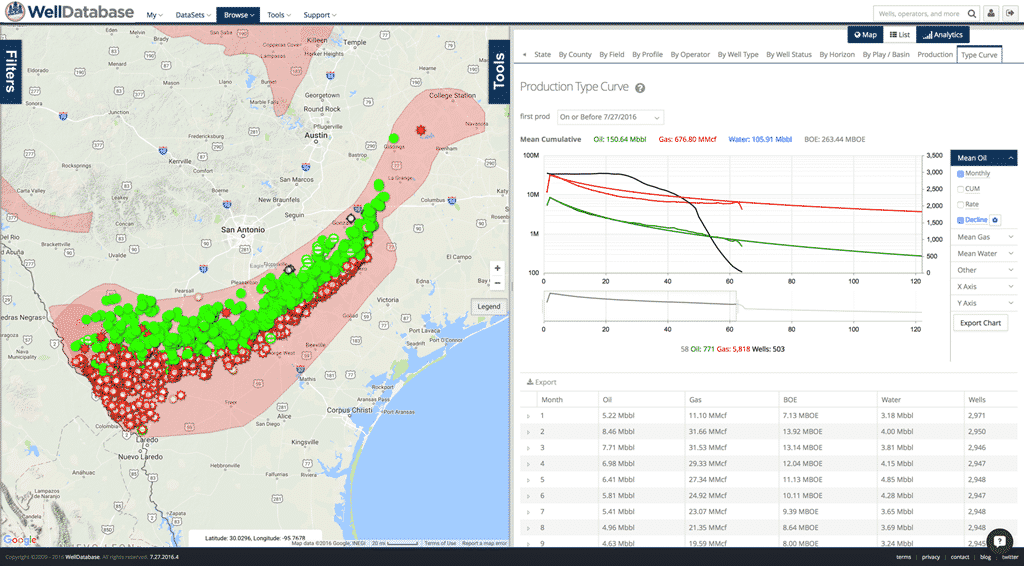
The difference is also very evident in their average type curve for these wells. I’ll drop in a handful of images to compare. Everyone loves pictures, right?
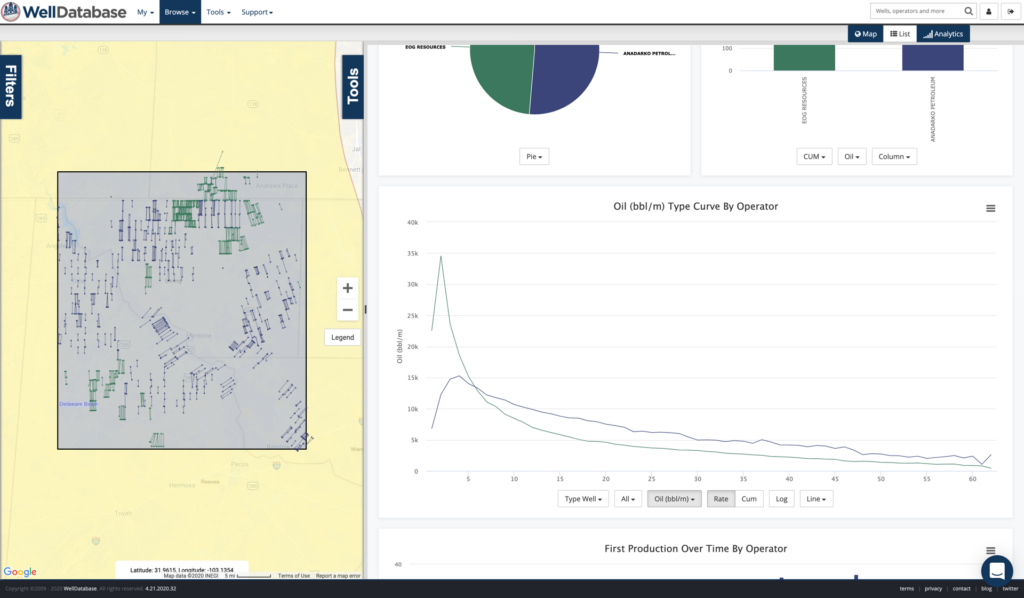


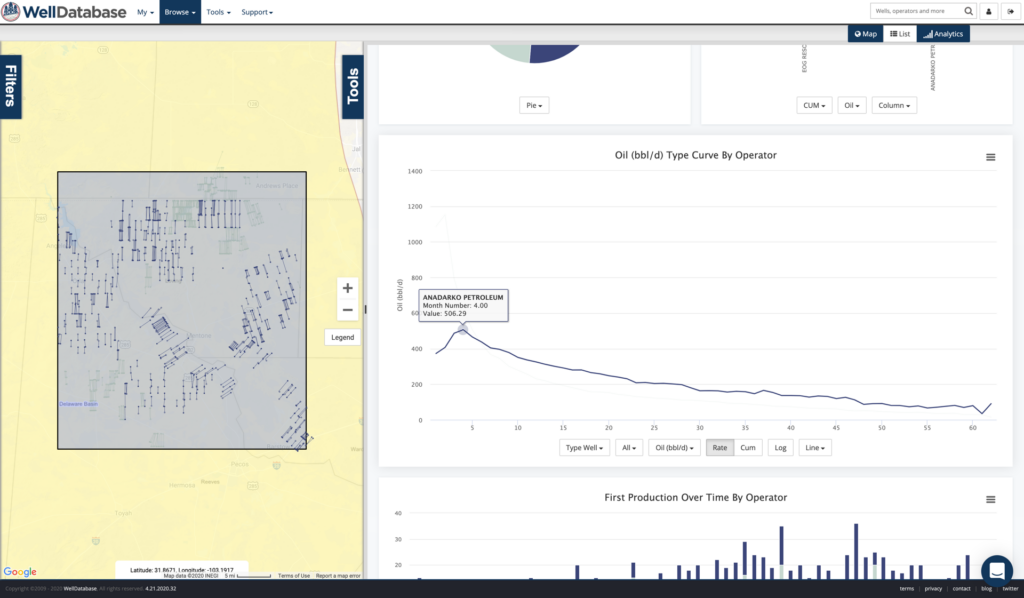
A quick review lays out a pretty simple comparison. EOG’s average wells produce significantly more in the first 6 months or so. At that point, Anadarko’s average wells jump ahead. It takes about 2 years for the cumulative to meet and then Anadarko widens the gap. At 60 months, the average Anadarko well has produced around 60,000 more barrels than the EOG well (377,000 bbls and 316,000 bbls respectively).
We should note that while these observations seems apparent, there are other factors. Access to capital, time value of money, infrastructure and others. Point being, it’s not black and white.
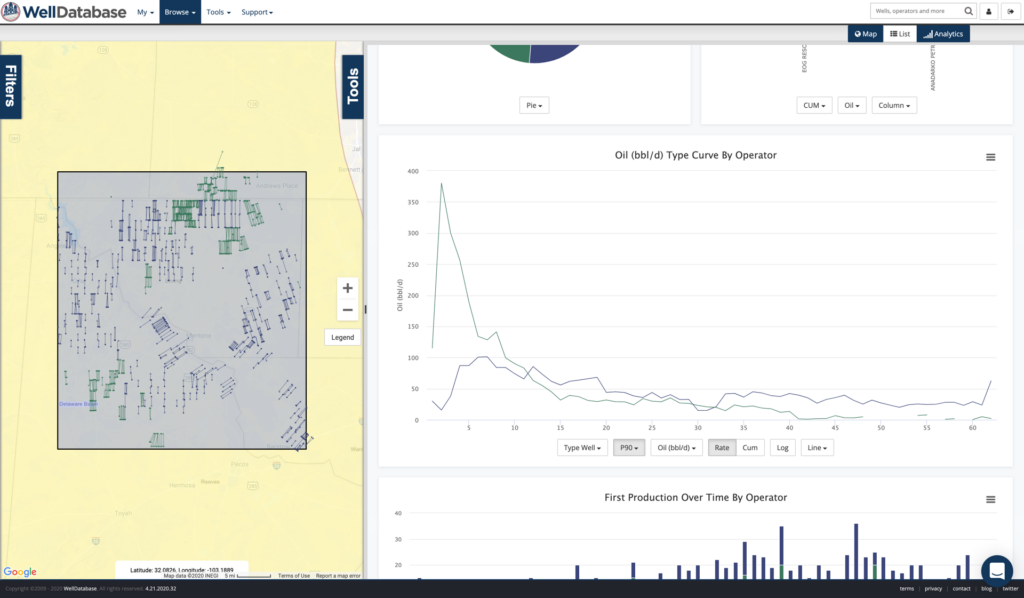
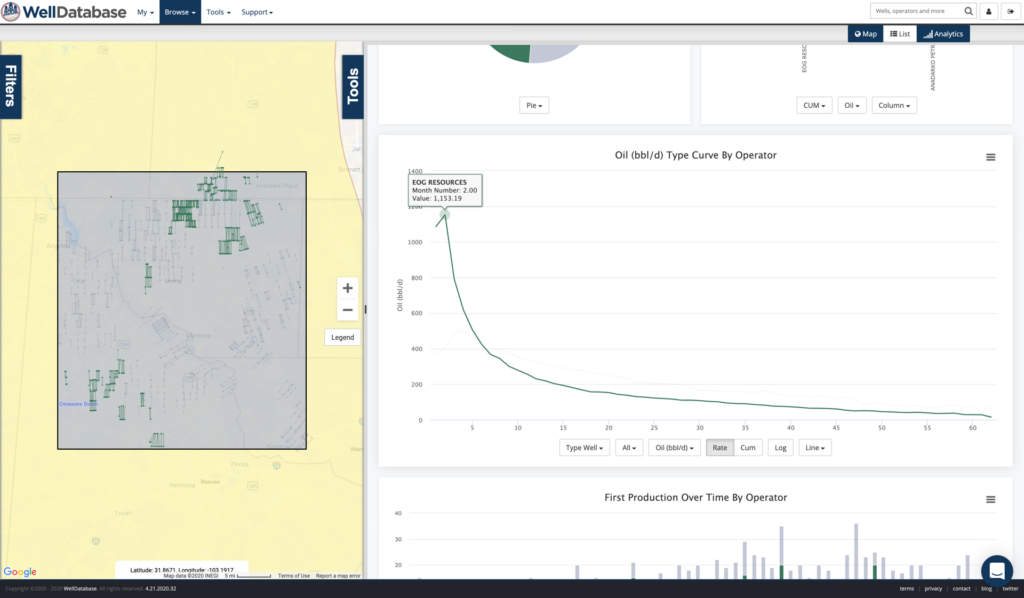
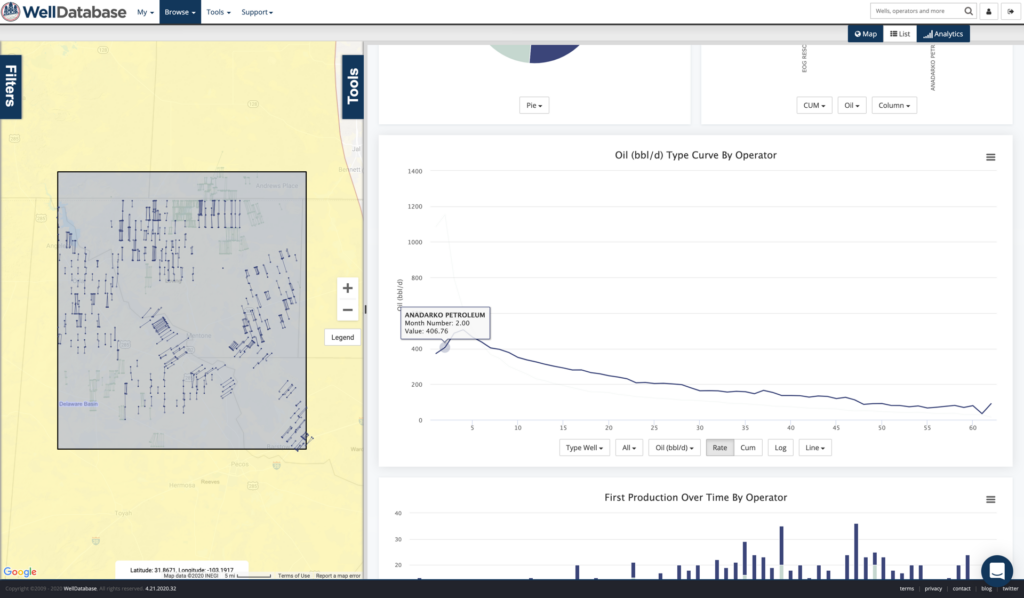
Our goal here is to understand what the effects of choking are to the bigger picture. Most of these values will be calculated by barrels of oil per day, so we’ll stick with that last chart. Let’s compare the numbers.
We can throw that in a table now and see how they compare.
| Month | 1 | 2 | 3 | 4 | 5 | 6 | 7 | 8 | 9 | 10 | 11 | 12 |
| Anadarko | 373 | 407 | 487 | 506 | 465 | 438 | 404 | 396 | 378 | 351 | 336 | 325 |
| EOG | 1086 | 1153 | 792 | 620 | 506 | 426 | 367 | 345 | 301 | 279 | 257 | 231 |
| Difference | -714 | -746 | -306 | -113 | -40 | 12 | 37 | 51 | 78 | 72 | 80 | 95 |
| Percent Diff | -66% | -65% | -39% | -18% | -8% | 3% | 10% | 15% | 26% | 26% | 31% | 41% |
So the point here is clear. If oil is bad/horrible/a train wreck in the immediate term, you might want to choke today’s production back and maybe make it back, and then some, in the future. The difference in our example is drastic for sure. 58% less production over the first 3 months. It would be a massive stretch to say that we could see these results at any scale. You can’t deny that the data is compelling enough to explore.

WellDatabase and NuTech Energy Alliance, LTD are proud to announce the allignment of their platforms to combine the best interpreted subsurface...
We’re proud to announce our partnership with Royalty Advocate.
We get asked all the time about the method we use to allocate Texas production data. For those who might not know, Texas requires operators to report...